By: Mohamed Ebsim
Ingenium
A lot has happened in our quest to build a weather station for the Canada Aviation and Space Museum.
In my last entry, I wrote about how I finished the 3D modelling; we were ready to print. However, my supervisor, Jesse, and I went to talk to Andrew MacDonald, new media officer/technological guru for Ingenium. Andrew has personal experience building weather stations, and he had a lot of good ideas to contribute to our plan. We discussed things such as sensors, and what is required to appropriately protect the sensors and devices from the weather. We have to remember that this weather station needs to endure +40 C and rain in the summer, and -40 C and snow in the winter.
We also discovered that the large upper box we modelled was too large to be printed in-house. But after consultation with Jonathan Cousineau, electronics expert at Ingenium, we decided we don’t need to print one. Our new plan is to use an off-the-shelf, waterproof electronics box, instead of the large box I designed. This would ensure that the electronics will not be touched by the elements, and it’s also a lot easier to get (it doesn’t need ~10 hrs to print). We do still plan on using the smaller ventilated box, as it still fits the need it was designed for.

New box with Raspberry Pi for scale
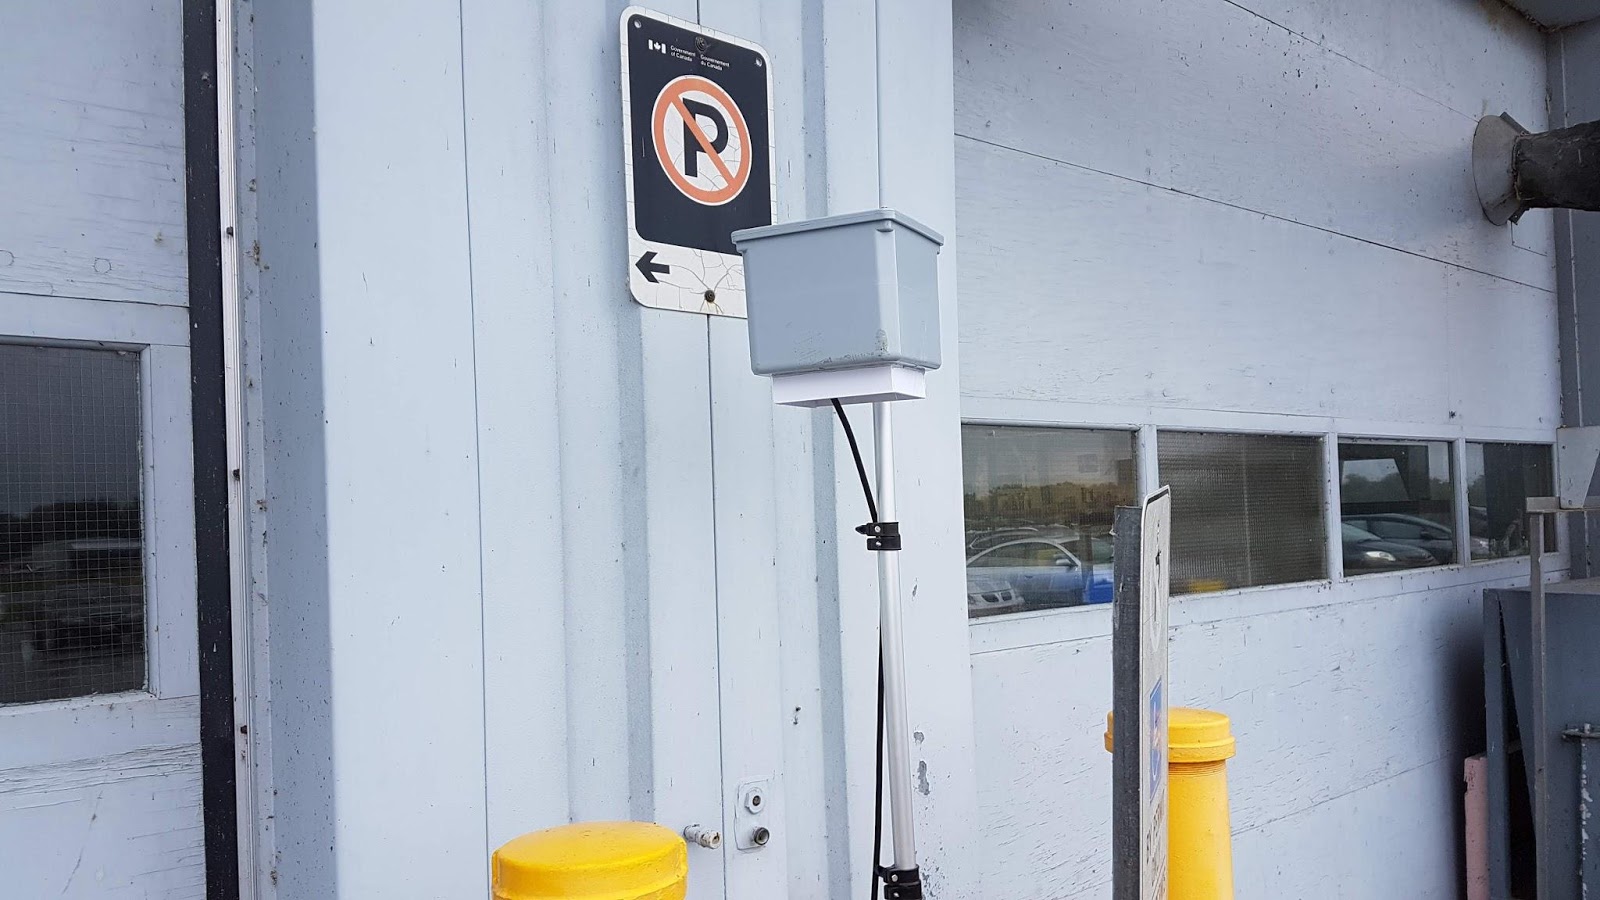
While we sort out the logistics, we wanted to test the systems outside. Although I have already proven that the sensors can collect data inside, taking it outside and getting real weather data will test the sensor functionality in its real-life, outdoor setting. To do the testing, we got a large, used electronics box from Jason. With his help, we made the required modifications so we could place it outside; this included patching up holes and running power into the box. We left a small rectangle on the bottom of the box to allow our sensors to pop out, and it served as the entrance for the electricity. I actually got the fun opportunity to build an extension cord, as we wanted to put it in the box without having to cut extra holes for the ends to go through. Then we added a lip on the bottom, to ensure water does not run along the bottom and onto the sensors. Jason added a wooden structure to the side, so that the box could stand on a pole he supplied.
The final step was to put the electronics inside. We ensured that the sensors were getting a good amount of wind and moving air. Finally assembled, we took it outside and plugged it in next to the museum’s woodshop building.

Jesse surprising me with a photo while I set up the weather station
Now it’s just a waiting game. Since there is not a good WiFi connection outside, it was difficult to tell if the data is collecting properly. You just have to wait and see the data when we pick it up the next day. This first run, I had accidentally left the counter at a measurement every quarter of a second. With all the programs that are running, a set of temperature, pressure and humidity data gets stored every second. Since we left it running overnight, a total of nearly 24 hours, you can imagine that’s a lot of data! We got a total of 72,912 entries over the time we were testing.

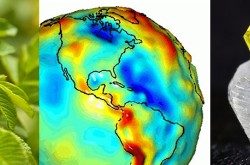
Temperature (top), relative humidity (middle) and pressure (bottom) graphs, using data collected in our first test. Our data is coloured dark blue; the grey, green, and red are data collected by Environment Canada from Gatineau, CDA and Ottawa International Airport, respectively. All data was collected on July 25.
Some actual data! It’s nice to have visible progress. At first glance, our measurements for temperature and humidity generally follow those of the nearby government-run stations. However, for the data around 5 p.m., the temperature shot up and the humidity plummeted. We are not quite sure why this occurred, but we will collect more data to try to find out. In addition, our pressure sensor measured the exact same pressure the entire night, which does not match any other source of data in the city.
On July 26 we put it out again, this time making sure it only collected data once every five minutes.

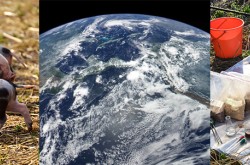
Second day of data, collected on July 26
In the temperature graph based on data from July 26, the big difference between our data and the government station’s data is at the beginning, roughly between 5 p.m. and 8 p.m. Instead of dropping as the other stations do, from 28 C to 22 C, it spikes first, from 28 C to 35 C, then quickly falls to match the others at 22 C. Our humidity measurements are also different from government measurements. Between same hours, the government stations increase slowly from 45% to 60%, whereas ours initially dips down to 30% before returning to match the others. Again, the pressure remained constant, unlike any other source of data.
The real question is, where are these differences between our data and the government data coming from? Why does our data spike when other stations don’t? Perhaps it’s because the other measurements are being made at different locations in the city? More tests - over longer periods - are going to be needed in order validate the differences in data.

This map indicates the locations of the weather stations. The blue pin indicates the location of the Canada Aviation and Space Museum, the grey pin is the Gatineau weather station, the green is the CDA station and the purple pin is the weather station at the Ottawa International Airport.
It has been exciting period. A lot of planning and work has gone into this, and going out and gathering data has been the tipping point from which things start to speed up. To date, we’ve collected a nice amount of data, but I still want to take at least one more long test run to try to figure out why our data differs so much from the other area weather stations. I’m even more excited for what’s to come as we set out to make the finished product.
All the code that has been made can be found at the project’s GitHub page: https://github.com/CASM-WeatherStation

Mohamed Ebsim is an intern at the Canada Aviation and Space Museum, working under Science Advisor Jesse Rogerson. He is also a high school student at Ashbury College.