Opening a digital window on our way of life
Half a century ago, you would have regularly heard Canadians discussing the Apollo moon landings and the future prospects of space travel, but there would have been far less talk about the state of water or air pollution. Today, we hear far less about other planets than the environmental state of this one. Much of our current discussion is voicing frustration and distress over the possibility that the very technological progress enabling us to visit other worlds may have done irreparable harm to the only one we can call home.
Such progress has given us innovations — like manufactured fertilizers to feed unprecedented numbers of people, and chemical processing methods that have made food products less expensive and more widely accessible than ever before. We have also developed powerful scientific tools for measuring and assessing how these innovations can affect the quality of our drinking water, or the air we breathe. These tools are no longer exclusively in the hands of highly-trained specialists. They now include cell phones, tablets, and desktop computers that offer each of us a gateway to understanding the changes taking place in our environment, as well as the causes of those changes.
A key example of this capability is the federal government’s National Pollution Release Inventory (NPRI), an extensive database that dates back to 1993, the same year when the World Wide Web became a publicly available system.[1] Back then, the idea of a “web browser” was practically unknown and the contents of the NPRI was distributed on CD-ROM disks. Today, anyone with Internet access can simply visit canada.ca/npri to explore this repository.

How the NPRI helps inform decisions on protecting the environment
Empowering Canadians with knowledge
The website offers you the “who, what, and where” of hundreds of different chemicals produced by thousands of facilities across Canada. While it does not collect data about all forms of pollution and their sources, it is a straightforward and accessible means of empowering Canadians with knowledge about how pollution is affecting their communities.
The NPRI website offers a versatile search window[2], which allows you to make specific inquiries: you can track any given pollutant, as well as learn more about its physical properties; you can find out the source of that pollutant, specifically the type of industry and even the particular companies that produce it; you can identify the pollutants near any location in Canada, simply by entering a postal code. Above all, the NPRI’s archive allows you to observe any changes that have taken place over the years — such as whether the output of a pollutant has been increasing or decreasing — along with the number of places where that pollutant is produced.
While the word “pollution” conjures up images of the heaviest of industrial installations, such as a steel foundry, the NPRI features any kind of commercial operation that emits a chemical of interest into the air, water, or land. This includes many sectors that may not come immediately to mind, such as plants processing agricultural products into the foods that line grocery store shelves. Familiar items such as cookies or breakfast cereals all get their start in large-scale cooking operations, which at the very least turn out particles of soot from smoke stacks. These facilities must be equipped with filters and scrubbers to prevent agents such as nitrogen oxides from escaping into the atmosphere. Such operations can also emit other pollutants, like volatile organic compounds, which are likewise documented in the NPRI.

Seeing the impact of our way of life
Exploring this giant database is a way of putting into perspective the impact that our way of life has on the environment. For instance, Canada’s global reputation as an agricultural powerhouse depends on an ability to nurture large volumes of crops from the soil, which is regularly enriched by fertilizer manufactured at a number of different factories across the country. By entering the names of one of these factories into NPRI’s search engine, it will provide you with details of the pollutants that are associated with this kind of work. This information can also be shown in standard database formats, such as Microsoft Excel, or on maps that interact with the popular application Google Earth.
Under the terms of the Canadian Environmental Protection Act, some 8,000 companies across the country must now submit annual reports on the pollutants they emit. Each new set of data becomes part of the NPRI, which has been growing in this way since this legislation was passed in 1987.
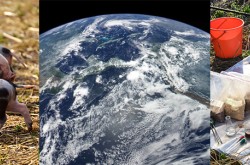
This is powerful, public information, the latest and most prominent expression of a trend that began decades ago when those same moon landings forever altered our perception of the environment. Like tourists in any new destination, astronauts took “snapshots” through the windows of their spacecraft. These were the first photographs anyone had ever taken of our entire planet, isolated and surrounded by empty darkness. It became immediately clear to anyone that we live in a closed system, one that contains not just water, air, and soil — elements that sustain life — but also the by-products of our industrial civilization, which include many chemicals we have come to regard as harmful pollution.
These images confirmed an uncomfortable truth: we co-exist with all of these chemicals — there is simply nowhere else for them, or us, to go. If these agents are harming us, then, we must find ways of eliminating or controlling them. Due to these negative consequences, governments and scientific organizations around the world mounted increasingly ambitious efforts to track these many different agents, especially those that might pose a threat to human health[3].

Emissions of sulphur dioxide, an agriculture-related air pollutant, presented in a data visualization dashboard.
Providing environmental accountability
Eventually, information about thousands of different industrial products were being tabulated and shared internationally, often with the goal of restricting or at least closely monitoring those that were regarded as particularly hazardous. Some, such as polychlorinated biphenyls (PCBs), which had a variety of uses (such as hydraulic fluids), were found to be so toxic that their production was banned. Other kinds of substances remained available for companies to use in their activities, but only under conditions of close regulation and reporting to independent authorities.
While various countries have taken different approaches to communicating their environmental management strategies to the public, the NPRI has emerged as a key portal for this initiative in Canada. To the same extent that we might monitor how much plastic we are throwing out in our household garbage or whether our fast-food coffee cup is recycled, the NPRI imposes a similar accountability — if on a much grander scale — for assessing the environmental impact of Canadian enterprises that are at the heart of our economy and our quality of life.
Have you ever thought about the pollutants created through Canadian food production? Learn more about how the National Pollution Release Inventory can be used to explore data in the article, “From plant to pantry: Tracking pollution in Canada’s food production.”
[1] https://web.archive.org/web/20090813032723/http://tenyears-www.web.cern.ch/tenyears-www/Welcome.html
[2] https://pollution-waste.canada.ca/national-release-inventory/archives/index.cfm?lang=En


